30 August 2020
The Evolution of Australia’s Newest Road Traffic Analysis Software
ITS Australia
ITS Australia member Intelematics has been in the business of data for over 20 years. As a society, the collection and application of data have improved astronomically in that time. We’ve seen the emergence of Big Data, the Internet of Things, Artificial Intelligence (AI) and Machine Learning. As the world moved through this digital and data transformation, Intelematics consistently capitalised on new data capabilities to become the main provider of real-time traffic information for over 75% of the Australian auto-manufacturing market.
However, in the last six months, the world has changed in more ways than one. And these changes have forced governments, businesses and individuals to take stock of their reality, reflect and rethink the way forward.
Intelematics has been closely tracking road traffic for years and continued to do so through the pandemic. We have always strived towards providing different stakeholders with a single source of truth, and the right set of tools for informed decision making.
The birth of SUNA: Australia’s real-time traffic staple for twelve years and counting
Data has always been at the core of Intelematics as a business. Before we talk about the present and future of our data capabilities, it is important to acknowledge the past.
I’d like to take you back to 2008 – the beginning of our mobility data journey. In that year, we introduced Australia and New Zealand to SUNA Live Traffic (SUNA). SUNA was our first foray into harnessing mobility data to improve the efficiency of our road networks.
SUNA is a comprehensive real-time satellite traffic information service that provides live traffic updates directly to in-vehicle and compatible GPS devices.
SUNA collects real-time data on live incidents, traffic flow and congestion levels. That data is then processed by Intelematics and communicated to drivers’ on their in-vehicle navigation devices. When SUNA first launched, this data was only transmitted through FM radio broadcast. Nowadays, while data captured through SUNA is still transmitted through FM radio broadcast, it is also communicated through mobile data.
SUNA has been keeping Australians and New Zealanders moving for the last 12 years. SUNA is currently licensed by 75% of the Australian vehicle manufacturing market and covers 90% of traffic across Australia and New Zealand.
This means that for more than a decade, we have collected a bank of historical mobility data. Slowly but surely, we have been building a comprehensive view of the Australian and New Zealand road and traffic network. In the process, we have identified the impact certain conditions have on traffic and traffic trends over the years.
Having recorded over 200,000 incidents to date, we specialise in historical and real-time traffic data for speed, congestion, volume and incidents. Our road traffic data is collected through thousands of probes and sensors located on roads, in vehicles and infrastructure with collections as rapid as per second frequencies. We enrich our data using multiple proprietary sources and machine taught algorithms.
When it comes to SUNA itself, the data communicated through the channel is only valid and useful if it’s live. Once the data became dated (or historical), it lived in our system – unused.
This is when we started having conversations internally about how we could harness our historical traffic data to derive insights that would offer more value, not just for our end users – the vehicle manufacturers and their customers – but the wider public, policymakers, engineers and urban planners in designing a more robust, intuitive and futuristic road network.
INSIGHT’s inception was the answer. Its purpose is to ensure we can look into the past and draw meaningful insights to ensure we build a better future. Providing every stakeholder with the ability to use insights powered by Big Data, Artificial Intelligence and Machine Learning and get a peek into what the future might look like.
Data evolution – INSIGHT: The first historical mobility datastore
As a first step, we set about adding structure to the massive amounts of historical data we had collected for more than a decade. To do this, we began sorting the data by flow (average speeds), volume (average vehicle count), and origin and destination.
Then we grouped the data by time (year, month, day, hour, minute, time intervals) and location (local government area, suburb, street name, road sections, unique IDs). We then went about turning the historical data into easily downloadable files that had been transformed into a structured, easy-to-interpret format.
Through our research, we discovered that the types of people looking for comprehensive mobility data typically included, local councils, traffic and transport engineers, infrastructure planners, urban designers and construction companies. They needed this data to assess the site and land-use locations to demonstrate the viability of their plans to their teams, boards or local constituents.
We found that there was a need for quality, high-resolution traffic data and insights. Why? Because there was a strong pipeline of national projects and these projects were relying on difficult to decipher, open-source data which differed by state and was rarely kept up to date. Therefore, a lot of analysis and preparation work would be required to transform the data into a format that could be easily understood by a construction company’s board or management team, or a local council.
The industry was lacking a centralised data source that provided mobility data for the whole country. We sought to rectify this problem. We wanted to give them a one-stop-shop for all their mobility data needs. Our goal was not only to harmonise the data but also to make it as user-friendly as possible.
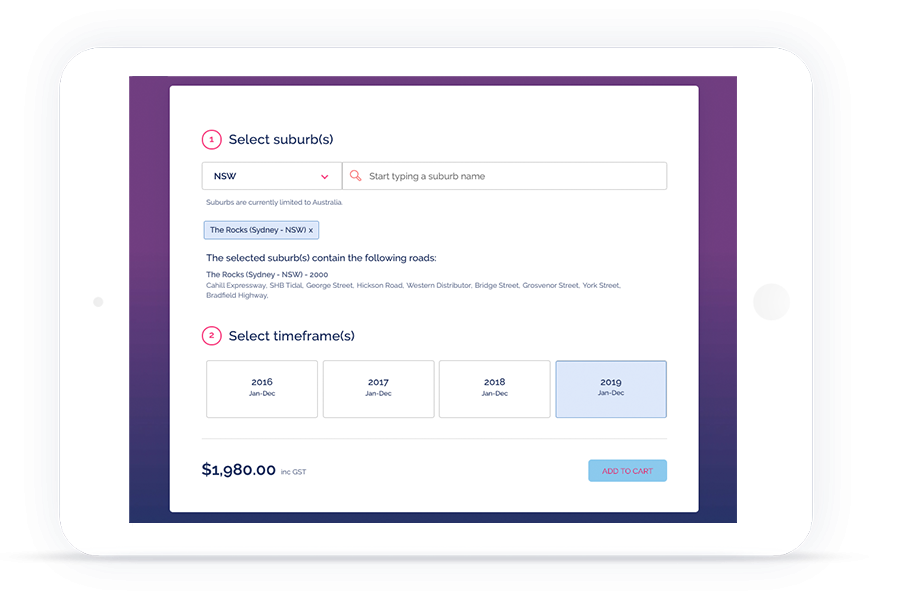
Our first iteration of INSIGHT was – a data store. At the beginning of2020, we released traffic flow data files for over 2,000 Australian suburbs and made them available for online purchase. The files provide average travel speeds for any given location at any given time of day in an easy-to-interpret .csv file. The files were available for once-off purchase based on the location and timeframe customers were searching for.
Being able to download the data file in an easy-to-interpret format saved time and money for all involved. The ability to download historical data meant that comprehensive traffic analysis could be conducted from any location. It also meant that companies could rely on historical data to conduct an accurate analysis for projects commencing in 2020. In addition, by receiving a file where the analysis had already been done, our customers were saving on having to pay third-party suppliers to conduct an analysis and crunch the numbers on their behalf.
However, this wasn’t all we had planned. We wanted to build a platform that our customers could continually visit to get the data-backed mobility insights they needed, anywhere and anytime. A platform that analysed and visualised the data and further lightened their workload.
Coming of age – INSIGHT: Australia’s newest road traffic analysis and insight software
Our traffic data files are available for a once-off purchase. With the launch of INSIGHT, our customers can log in to view historical traffic speed, congestion and volume data.
We’ve also taken the analysis a step further. INSIGHT does the decoding for you so that the whole story can be told visually. The portal offers customisable graphs based on different inputs. You can simply take a screenshot to include the graph in presentations or tender documents, for example. However, full breakdowns of figures are still available for those who require that extra level of granularity.
INSIGHT offers traffic speed and congestion data and traffic volume data, which represents the number of vehicles on any given road at any given time. At present, users can access 18 months of data (Jan 2019 – Jun 2020). Data from 2016 to December 2018 is available on request.
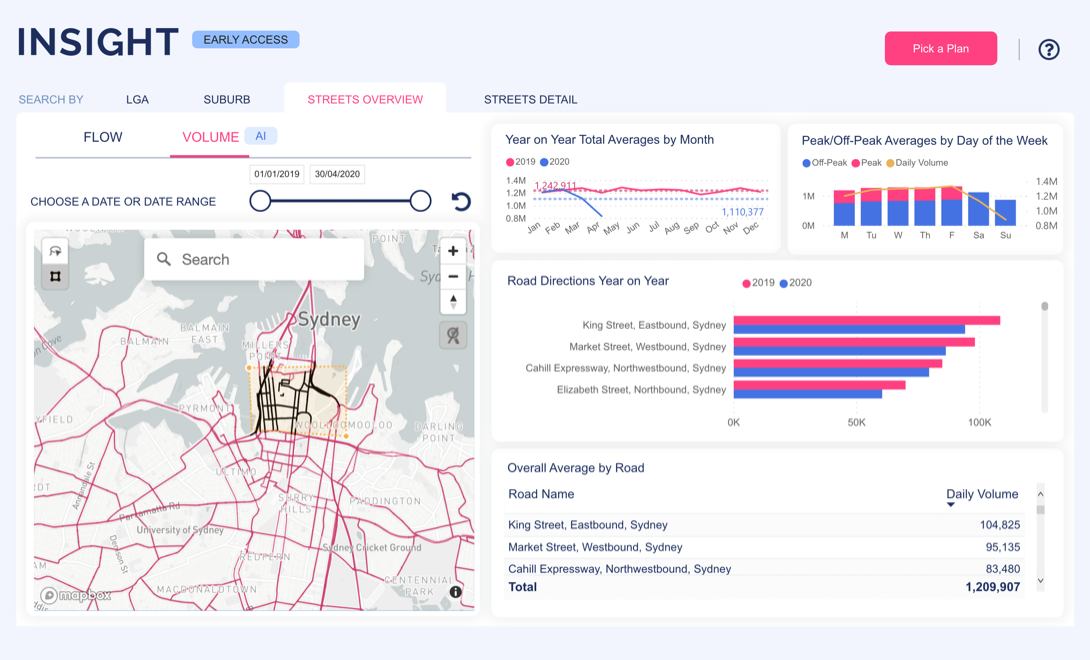
Currently, there are three inputs that can be changed – road, suburb, local government area. These inputs can then be mapped against time. The portal provides Annual Average Daily Traffic (AADT) figures, average traffic volume for months in the year, days of the week and daily peaks and off-peaks.
What does the future hold?
In the first instance, traffic flow data and traffic volume data for New South Wales is available in INSIGHT. Before too long national data will be available and for all roads around Australia, not just metropolitan centres. We also plan to release aggregated traffic volume data by the hour. Origin & Destination data is also going to be available soon.
So, whether you’re a project manager, a traffic or transport engineer, an urban planner, a local government strategist, or even someone who’s responsible for outdoor advertising – Intelematics’ INSIGHT can help you with useful mobility insights.
PUTTING INSIGHT TO GOOD USE: How a construction company can seek approval for a traffic management plan
Picture this: you work for a national construction company with a strong pipeline of projects across Australia. There’s one project, in particular, coming up that has the potential to deliver a significant amount of revenue for the company.
The project in question is a major construction project taking place in a local government area that has a vocal local community. It’s your job to prove to both your company’s board and the local council that there will be minimal disruption to the flow of traffic in the area during construction.
To complete the construction, you must close a local street for two months. However, you have two options. It looks like both your options have similar levels of traffic. How do you decide which road is the right one to close to minimise disruption to local traffic?
Usually, you’d perform a traditional traffic survey. Book it in – collect data for a couple of weeks, analyse and then decide. Now, all you do is log in to Intelematics’ INSIGHT, lookup the two roads in question, and compare the impact of shutting each one down.
The portal immediately brings up the AADT for each of your roads. If the portal shows that one of the roads has an AADT count of 6,000, while the other has an AADT count of 10,000 then the choice becomes obvious. Shutting down a road that is a key corridor for 10,000 vehicles per day would wreak havoc with local streets, while a street that is a key corridor for only 6,000 vehicles is far more manageable.
You now have all you need to prove to your board and local council that you have not only thought through the impact of the project but have tangible evidence to prove that you can minimise disruption to local traffic.
Register for free here.